Additional literature
The data and methods behind the calculator, from market concentration to elemental scarcity.
The Herfindahl–Hirschman Index (HHI)
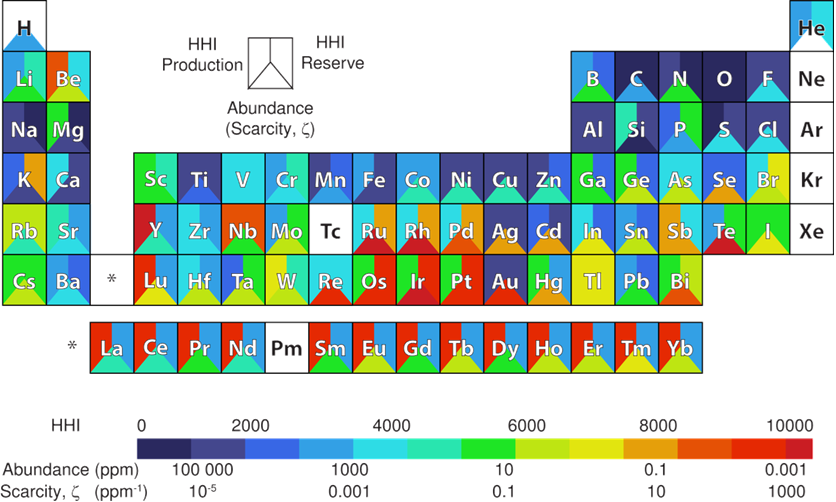
Searching for new materials requires weighing elemental accessibility and supply risk, including crustal abundance, global production, reserves, and use. The HHI measures the market concentration, and therefore the supply risk, of a commodity. Gaultois et al. calculated HHI values for production and reserves across much of the periodic table and compared them with elemental scarcity (Figure 1).1 The HHI of each element is the sum of the squared market shares of each producing country, based on either production or reserves.
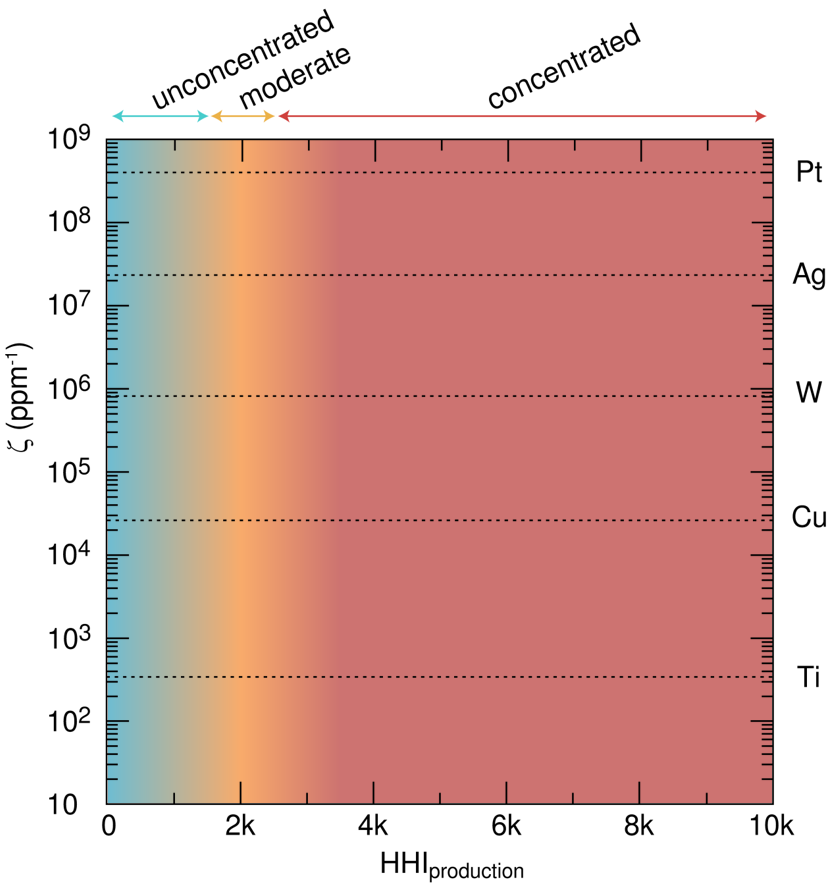
The U.S. Department of Justice and Federal Trade Commission deem a market highly concentrated, with high supply risk, when its HHI exceeds 2500. Values between 1500 and 2500 indicate a moderately concentrated market, and values below 1500 indicate an unconcentrated market with little supply risk.2 Figure 2 plots HHI (production) against elemental scarcity, similar to the chart on the Plot page. A composition in the lower left corner of this plot carries the lowest supply risk.
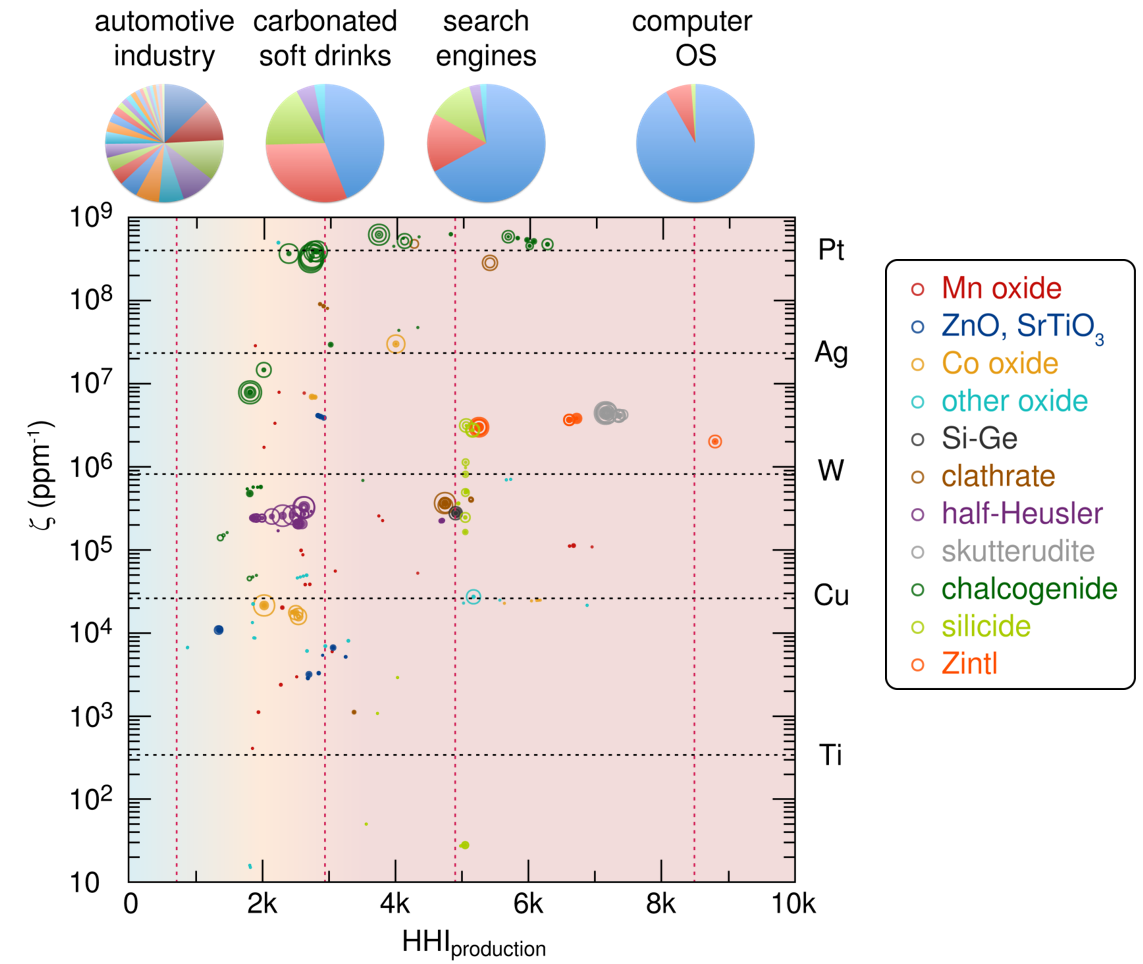
Gaultois et al. applied this analysis to high-performance thermoelectric materials and found that most carry a high risk from scarcity, concentrated supply, or both (Figure 3).1 Each composition uses HHI and scarcity values averaged by the weight fraction of each element in the formula. The calculator applies the same approach to any class of materials that relies on high-risk elements.
Updated HHI values
The calculator uses HHI values computed from the most recent USGS Mineral Commodity Summaries.6 Supply concentration has shifted since the 2013 compilation. The production HHI of the rare earths falls from 9500 to 5072 as China's share of mine production drops to about 70%, while gallium rises from 5500 to 9804 with China refining nearly all of the world supply. Mohanty et al. compiled the USGS data from 2016 to 2023 and present country-level production, reserves, and HHI trends for each commodity at mineral-ai.net.5
References
- M. W. Gaultois, T. D. Sparks, C. K. H. Borg, R. Seshadri, W. D. Bonificio, D. R. Clarke, “Data-Driven Review of Thermoelectric Materials: Performance and Resource Considerations,” Chem. Mater. 25, 2911–2920 (2013). doi:10.1021/cm400893e
- U.S. Department of Justice and the Federal Trade Commission, Horizontal Merger Guidelines (2010).
- A. Mansouri Tehrani, L. Ghadbeigi, J. Brgoch, T. D. Sparks, “Balancing Mechanical Properties and Sustainability in the Search for Superhard Materials,” Integrating Materials and Manufacturing Innovation 6, 1–8 (2017). doi:10.1007/s40192-017-0085-4
- B. Theler, S. K. Kauwe, T. D. Sparks, “Materials Abundance, Price, and Availability Data from the Years 1998 to 2015,” Integrating Materials and Manufacturing Innovation 9, 144–150 (2020). doi:10.1007/s40192-020-00173-5
- T. Mohanty, H. M. Sayeed, C. Mohanty, T. D. Sparks, “Comprehensive Insights into Global Mineral Commodities: Analysis, Visualization, and Intelligent Assistance,” PRX Energy 4, 023003 (2025). doi:10.1103/PRXEnergy.4.023003
- U.S. Geological Survey, Mineral Commodity Summaries 2026 (U.S. Geological Survey, 2026), with data release. doi:10.3133/mcs2026